
Weekly Recap: First Meaningful Pullback, +70.96% YTD, Three Setups Closed
Updates on Daily Swing Strategy, Monthly Momentum Breakout, $ES_F, Bitcoin, USOIL

Weekly and Daily Market Structure Review — June 5, 2026
Most readers encounter the strategy through weekly snapshots, outcome numbers, and charts that summarize what has already happened. Members, on the other hand, follow the full sequence while it is still unfolding, watching setups activate, evolve, expand, stall, invalidate, or reach objectives long before the outcome becomes obvious in hindsight.
This distinction matters because active setups represent ongoing structures rather than completed results. They are positions being tracked according to predefined rules, where the final outcome remains uncertain until the process has fully played out.
Another important clarification concerns performance reporting. The outcome figures presented throughout this publication are cumulative outcomes generated by individual tracked setups. They are not portfolio simulations, they are not compounded returns, and they are not CAGR calculations. They simply reflect the cumulative evolution of all tracked setups according to the rules of the strategy.
🔖 MENU
1️⃣ My $ES_F View Weekly – Where the Market Is Headed & Market Sentiment
2️⃣ Swing Strategy Weekly Recap
3️⃣ Monthly Momentum Basket
4️⃣ Bitcoin, USOIL, Gold – Weekly
⭐ PRO
5️⃣ My $ES_F View In Depth – Daily View
6️⃣ Bitcoin, USOIL, Gold – Daily
1️⃣ My $ES_F View Weekly – Where the Market Is Headed & Market Sentiment
📈 Weekly $ES_F — Structure & Behavior Recap
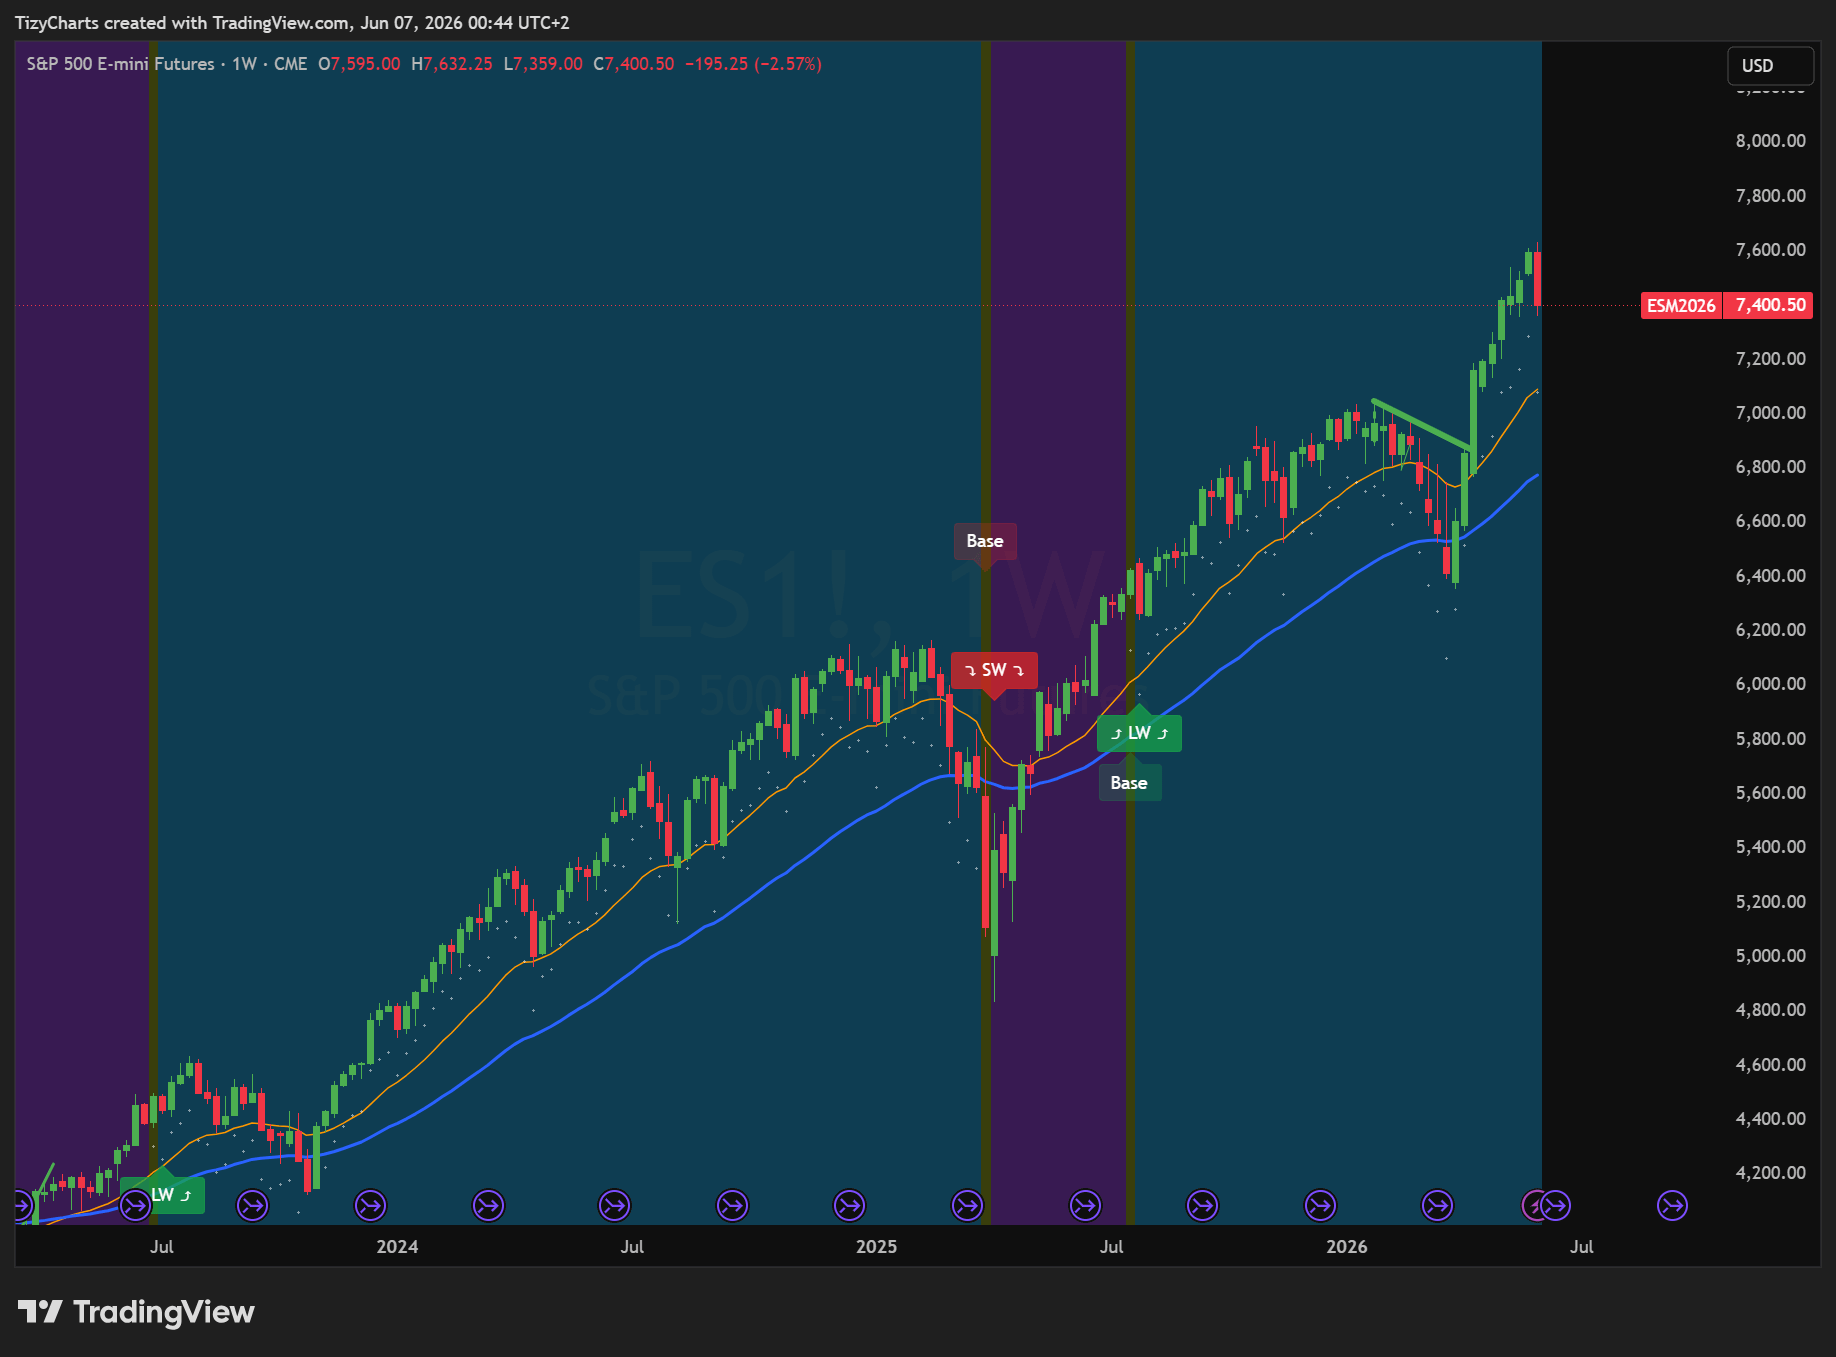
After nine consecutive bullish weekly candles, the market finally printed its first meaningful bearish weekly candle, closing the week down approximately 2.9%. Despite the decline, the broader structure remains surprisingly healthy when viewed through the lens of trend behavior rather than short-term emotions.
What stands out most is not the red candle itself, but rather how little structural damage has actually occurred. Even after this week’s weakness, price remains comfortably above the first major support area represented by the EMA21W, which continues to sit well below current levels.
This is often where perspective becomes important. After nine weeks of uninterrupted upside, any pullback naturally attracts attention, but from a structural standpoint the weekly chart continues to display a bullish setup inside an ongoing LongWave phase. Until key support areas begin to fail, the current move resembles a normal reaction inside a much larger trend rather than a confirmed change in behavior.
For a more detailed short-term assessment, please refer to the PRO section below.
2️⃣ Swing Strategy Weekly Recap
📈 Outcome Chart
📌 Setups Shared
Please refer to private tracking channels for detailed setup identification.
💼 Strategy Updates
Please refer to our private tracking channels for detailed setup identification. Every single day I provide updates showing how structures evolve, how active setups behave, and how risk management adapts as new information becomes available.
💹 Weekly Overview
This week the strategy experienced significant activity.
Three setups were closed, including one that completed its cycle with a gain of approximately +15%.
One setup was activated.
One setup was removed from the watchlist because market behavior changed before activation occurred, invalidating the original scenario.
We finish the week with seven active long setups and one active short setup still being tracked.
This is a useful reminder that the strategy is not simply about finding setups. It is equally about continuously reassessing whether the original conditions remain valid as new price action develops.
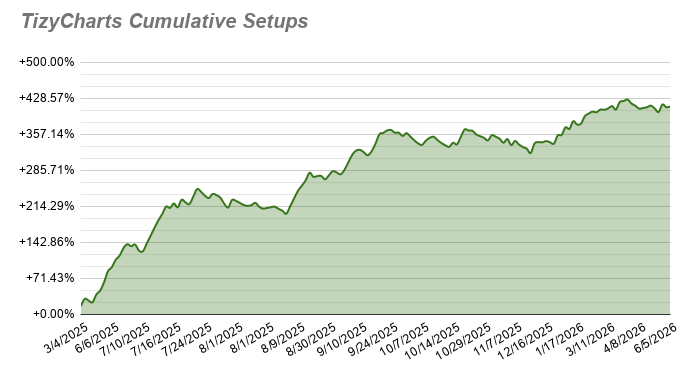
📈 Outcome Overview
YTD Performance: +70.96%
Outcome of Active Setups: +29.90%
Overall Outcome with All-In Risk Management (S.T.): +412.29%
Overall Outcome with Balanced Risk Management (S.T.): +334.71%
Three weeks ago active setups closed at approximately +11%.
Two weeks ago they closed near +30%.
Last week they reached +41.30%.
This week they close at +29.90%.
While public readers typically encounter these figures only after the fact, members follow the entire process while the outcome remains uncertain and the structures are still unfolding.
📌 Strategy outcome tracking reflects the cumulative evolution of tracked setups over time. It is not CAGR or standardized financial performance.
3️⃣ Monthly Momentum Basket Recap
The first week of the June basket has now concluded.
During the week, four activations were recorded while one setup was removed after losing structural validity before fully developing.
As always, the basket is designed to track a group of independent opportunities rather than relying on a single outcome. The objective is not prediction but participation when predefined structural conditions appear.
With three weeks still remaining, the basket remains very much in its active phase.
4️⃣ Bitcoin, USOIL & Gold — Weekly View
₿ Bitcoin Weekly
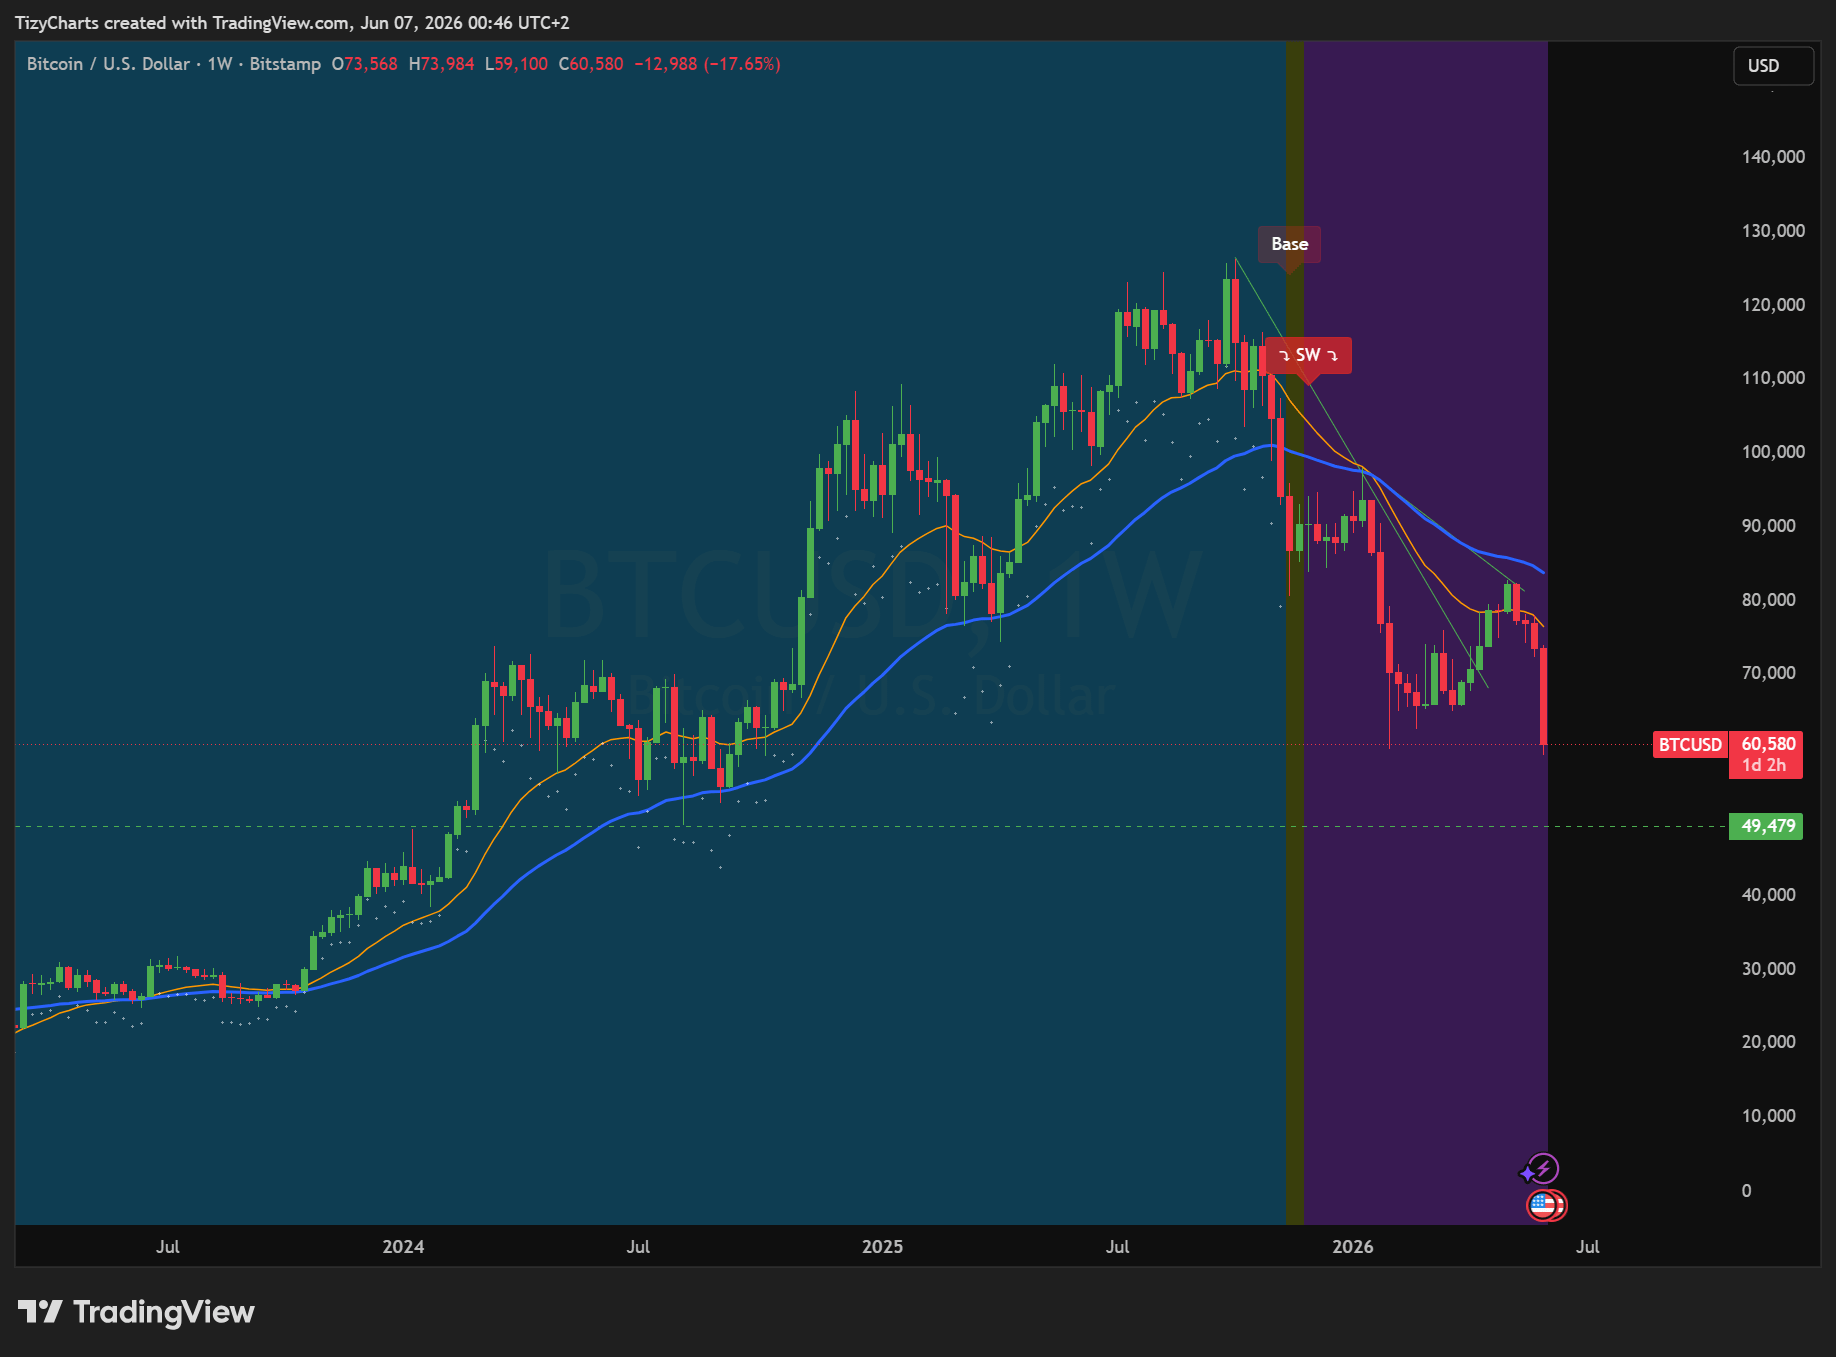
Bitcoin continues to weaken on the weekly timeframe and printed another bearish candle featuring a lower low. The rejection from the EMA21W has now become increasingly evident, confirming the transition from support to resistance.
The ShortWave phase that began around 90,406 remains active and continues to define the dominant structure.
The next major support area is located near 60,423.
🛢️ USOIL Weekly
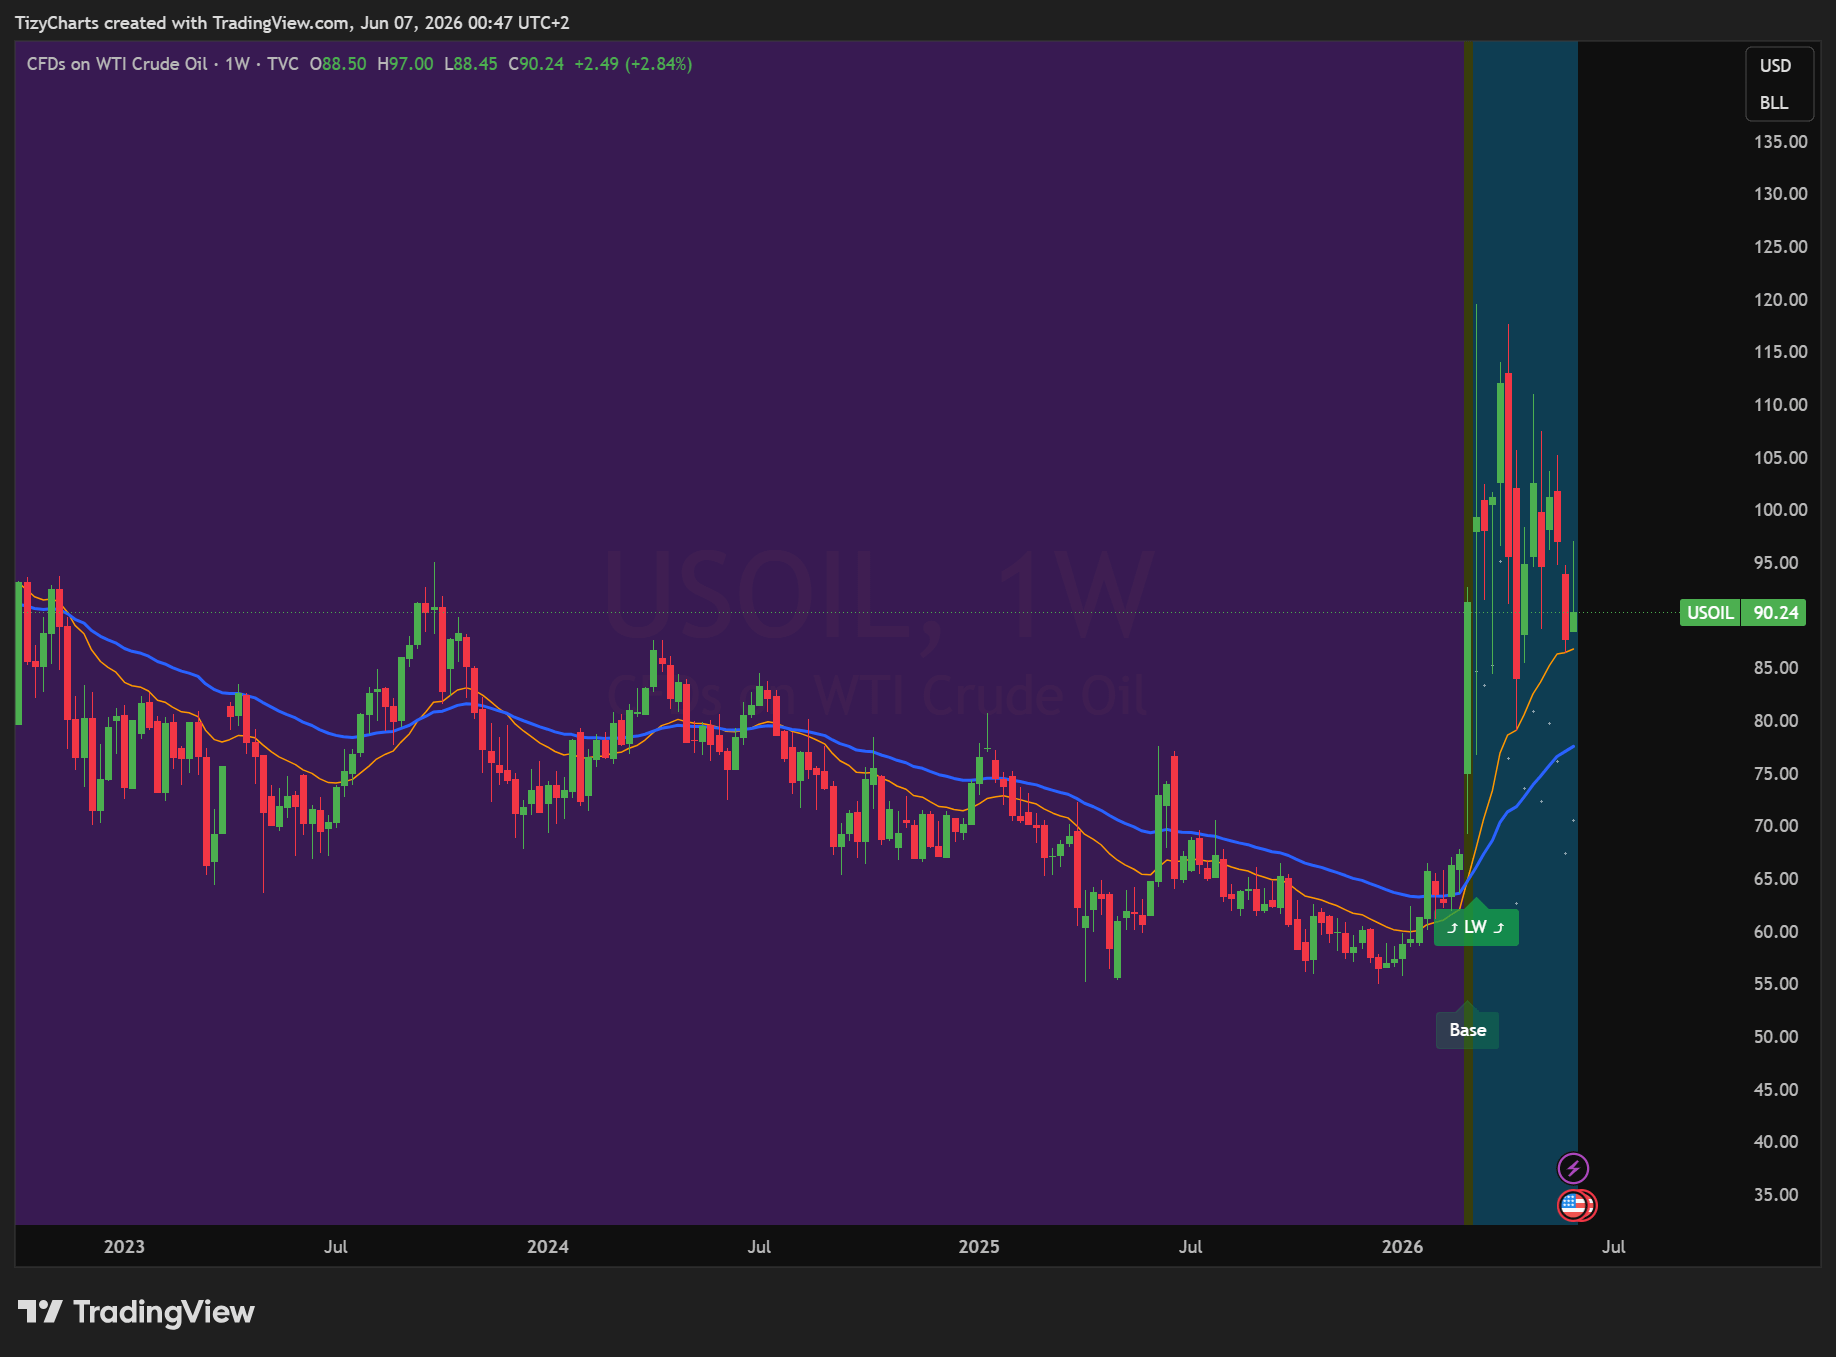
USOIL remains inside a LongWave environment despite another week of consolidation.
This marks the twelfth consecutive inside-type weekly structure, highlighting an unusually long period of compression and indecision.
Price continues interacting with the EMA21W while neither buyers nor sellers have managed to establish meaningful directional control.
🥇 Gold Weekly
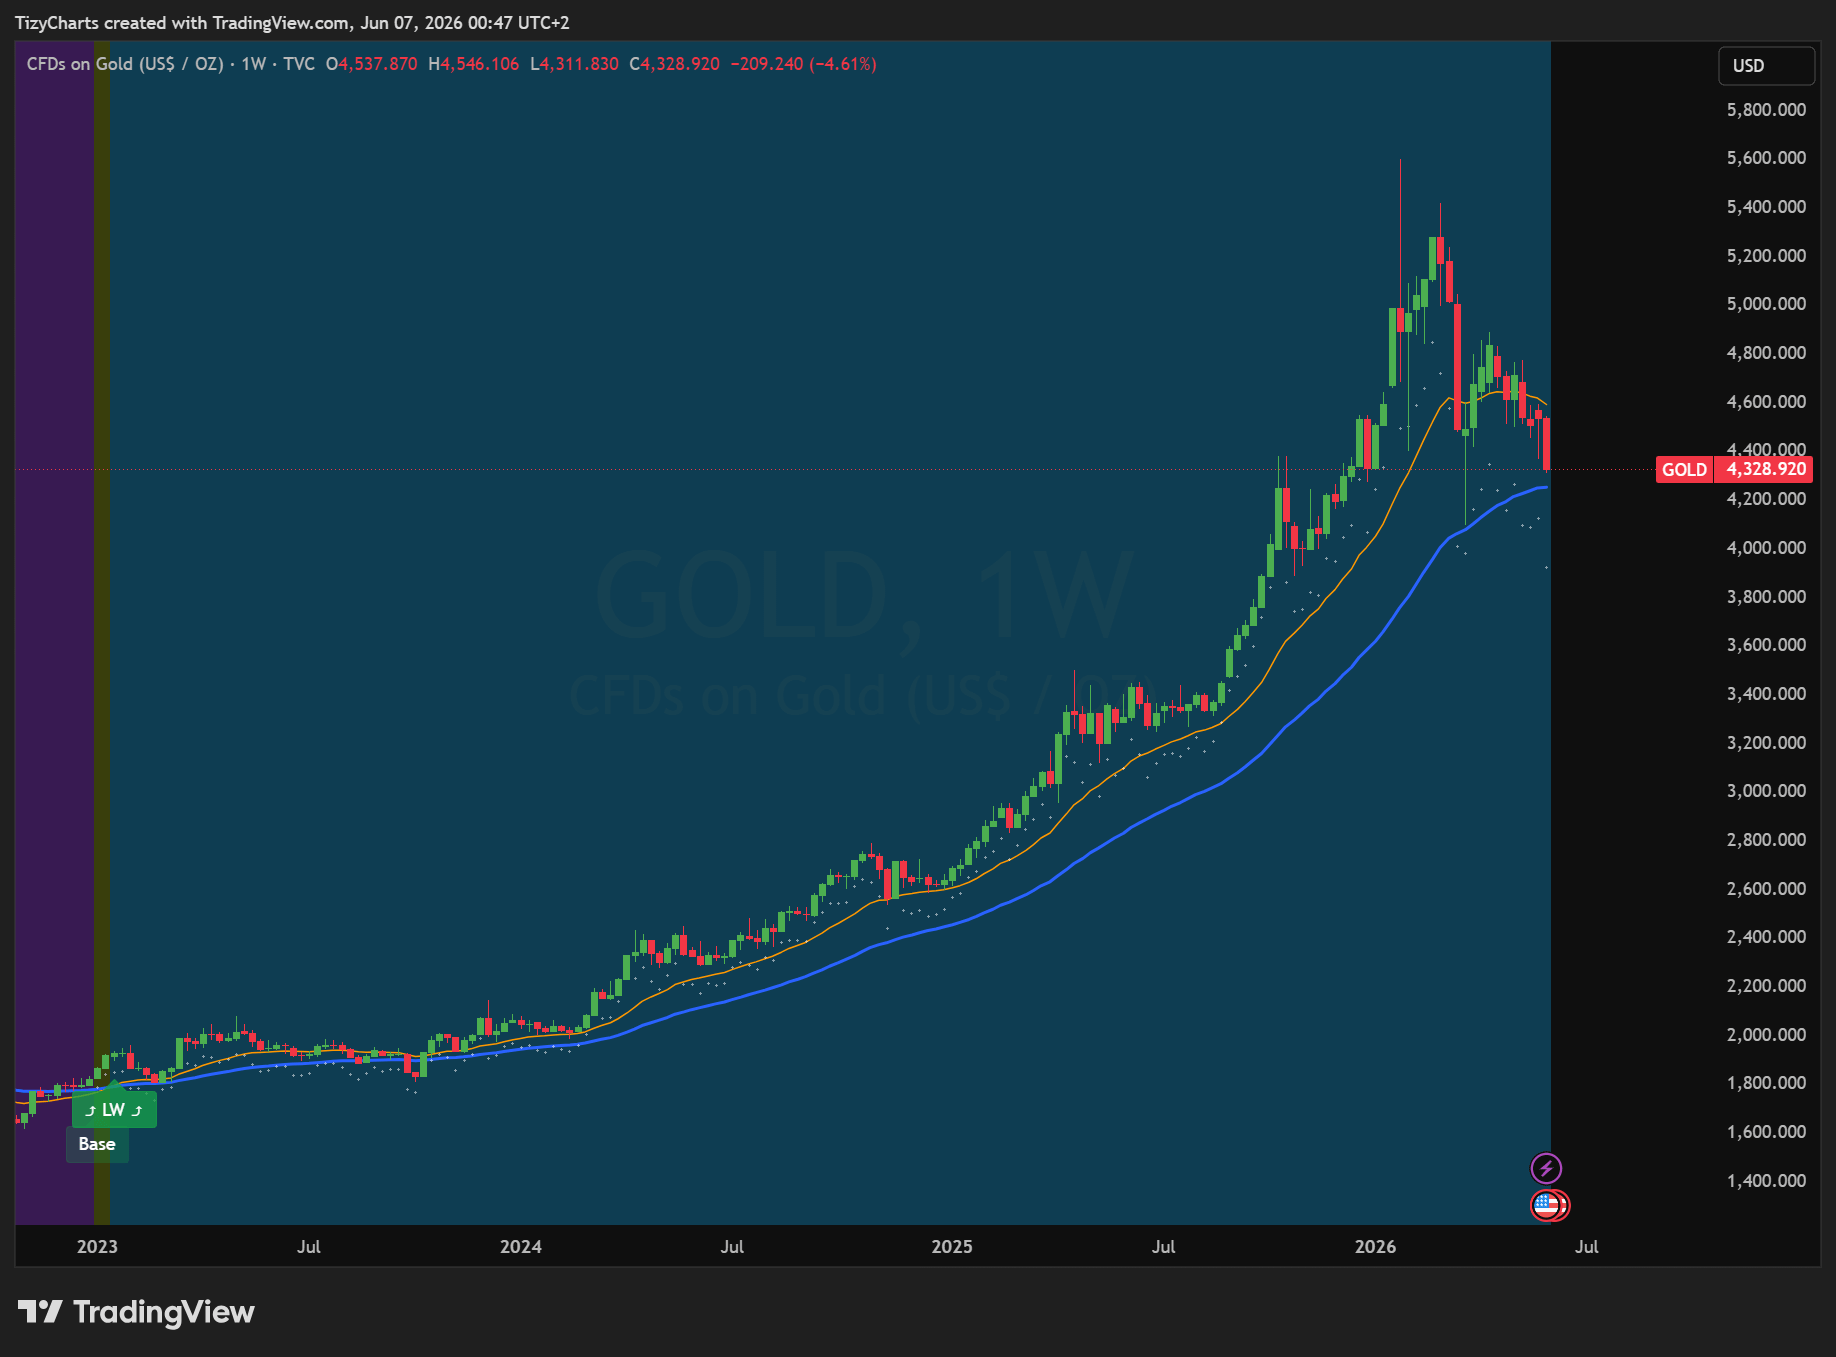
Gold remains inside the LongWave cycle that originally started near 1,925.
However, recent behavior has clearly weakened as price continues to print lower lows while using the EMA21W as resistance rather than support.
The next major area likely to attract attention is the EMA50W, which represents the next significant structural test.
Additional Notes
What Are Active Setups?
Active setups are structures that have already met activation criteria and remain under active monitoring according to predefined rules. Some will expand further, some will reach extensions, and others will eventually be switched off. Their final outcome remains unknown while they are active.
How Is Performance Calculated?
The outcome figures shown throughout this publication represent cumulative outcomes generated by tracked setups. They are not portfolio simulations, not CAGR calculations, and not compounded returns.
Dashboard Access
All dashboards, passwords, tracking pages, and access instructions can be found here:
🚀 Join the TizyCharts Community
👉 Free Telegram Channel:
https://t.me/tizycharts
👉 Free & PRO Plans:
https://tizycharts.substack.com/subscribe
🔐 Subscribers receive structured setup tracking, multi-timeframe analysis, active setup monitoring, and continuous updates while setups remain active.
