
Weekly Recap: Active Setups gained +20% this week, 2 New Activations, $ES_F Holds Structure Near Highs
MMB : $AAPL locked at +8%, Active Swing Setups at +30%. Updates on Bitcoin, USOIL. Daily and Weekly.

🔖 MENU
1️⃣ My $ES_F View Weekly – Where the Market Is Headed & Market Sentiment
2️⃣ Swing Strategy Weekly Recap
3️⃣ Monthly Momentum Basket
4️⃣ BITCOIN, USOIL, GOLD — Weekly
⭐ PRO
5️⃣ My $ES_F View In Depth (PRO, Daily View)
6️⃣ BITCOIN, USOIL, GOLD — Daily
1️⃣ My $ES_F View Weekly – Where the Market Is Headed & Market Sentiment
📈 Weekly $ES_F — Structure & Behavior Recap
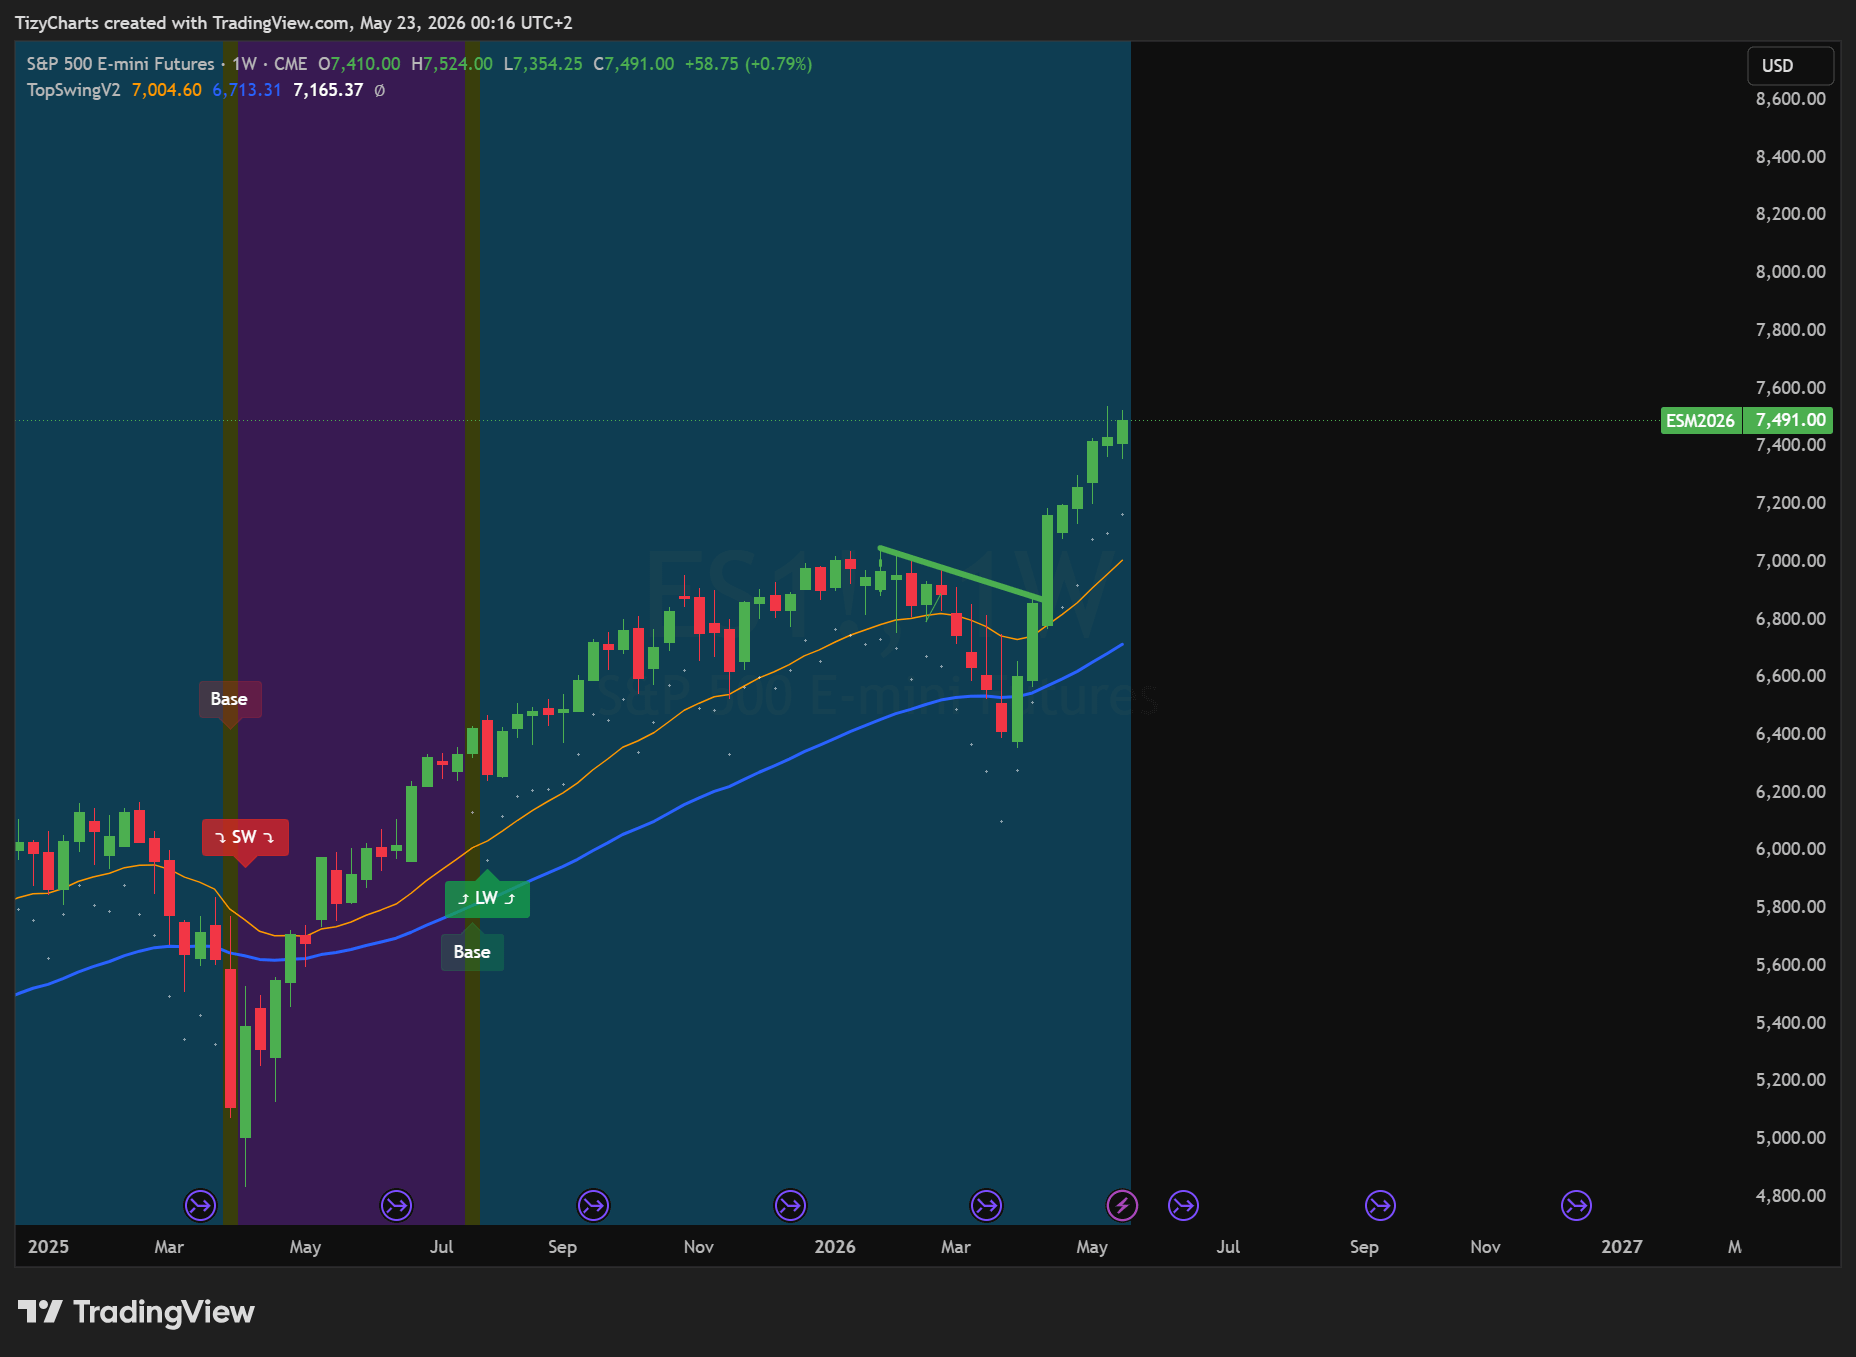
The index closed the week with a +0.77% weekly gain, printing its eighth consecutive bullish weekly candle, although unlike the strongest impulsive weeks seen earlier in the sequence, this candle behaved much more like an intrabar continuation structure with a close positioned in the upper half of the range rather than a fully aggressive expansion candle.
Perhaps the most interesting detail is that the market managed to maintain constructive structure even without printing a new record high, which usually tells us more about underlying positioning than a simple breakout itself, because markets that continue absorbing selling pressure near highs without collapsing often remain structurally stronger than they initially appear from the outside.
At the moment, the weekly setup continues behaving as a confirmed bullish structure, although momentum has clearly transitioned from vertical acceleration into a slower and more rotational phase where buyers are still in control, but where the path higher is becoming increasingly less linear.
That matters because from the outside, trends often appear easy only after several weeks of continuation have already passed.
Inside the process, however, maintaining alignment with the structure usually feels far more uncertain while it is still unfolding.
For a more detailed and shorter-term perspective, the Daily structure is covered inside the PRO section below.
2️⃣ Swing Strategy Weekly Recap
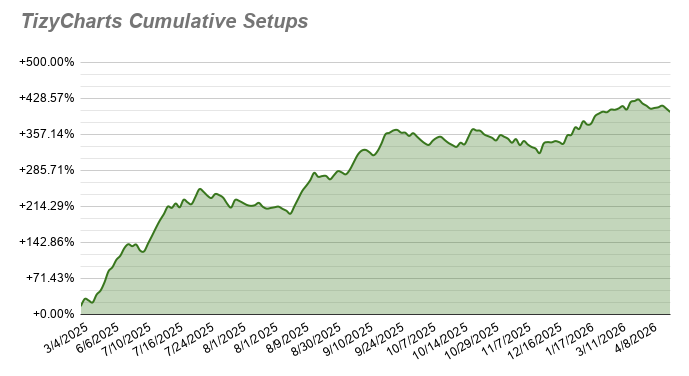
📈 Outcome Chart
📌 Setups Shared
Please refer to private tracking channels for detailed setup identification.
💼 Strategy Updates
Detailed setup management continues every single day inside the private tracking environment, where active structures are monitored through activations, extensions, invalidations, support behavior and evolving market conditions while setups are still alive rather than after the outcome becomes obvious in hindsight.
💹 Weekly Overview
This week produced:
2 new activations
We currently close the week with:
6 active long setups
1 active short setup
The most important shift this week was not necessarily the number of new activations itself, but the strong expansion inside currently active setups.
Last week, active setups had closed at approximately +11% cumulative outcome.
This week, active setups closed near +30% cumulative outcome, which highlights how quickly active sequences can evolve once broader market structure begins aligning again underneath the surface.
That does not mean the phase is resolved.
It simply means the current sequence continues unfolding constructively for now.
📈 Outcome Overview
YTD Performance: +59.98%
Outcome of Active Setups: +29.98%
Overall Outcome — All-In Risk Management (S.T.): +401.31%
Overall Outcome — Balanced Risk Management (S.T.): +252.49%
📌 Strategy outcome tracking reflects the cumulative evolution of tracked setups over time. It is not CAGR or standardized financial performance.
3️⃣ Monthly Momentum Basket Recap
📦 Basket 2026-05
The third week of the May Momentum Basket has now closed, with one remaining week left before the current basket completes its sequence.
Current active basket positions:
$GOOGL -1.25%
$AAPL +8.00% (closed)
$KO +1.42%
Current basket outcome so far: +8.17%
What stands out here is not simply the basket remaining positive, but the fact that leadership continues rotating rather than collapsing entirely, which is usually characteristic of broader constructive environments even when individual positions temporarily weaken.
Momentum structures almost always look cleaner after the strongest move already happened.
Inside the process, they often require patience during exactly these slower rotational phases.
4️⃣ BITCOIN, USOIL, GOLD — Weekly
₿ Bitcoin Weekly
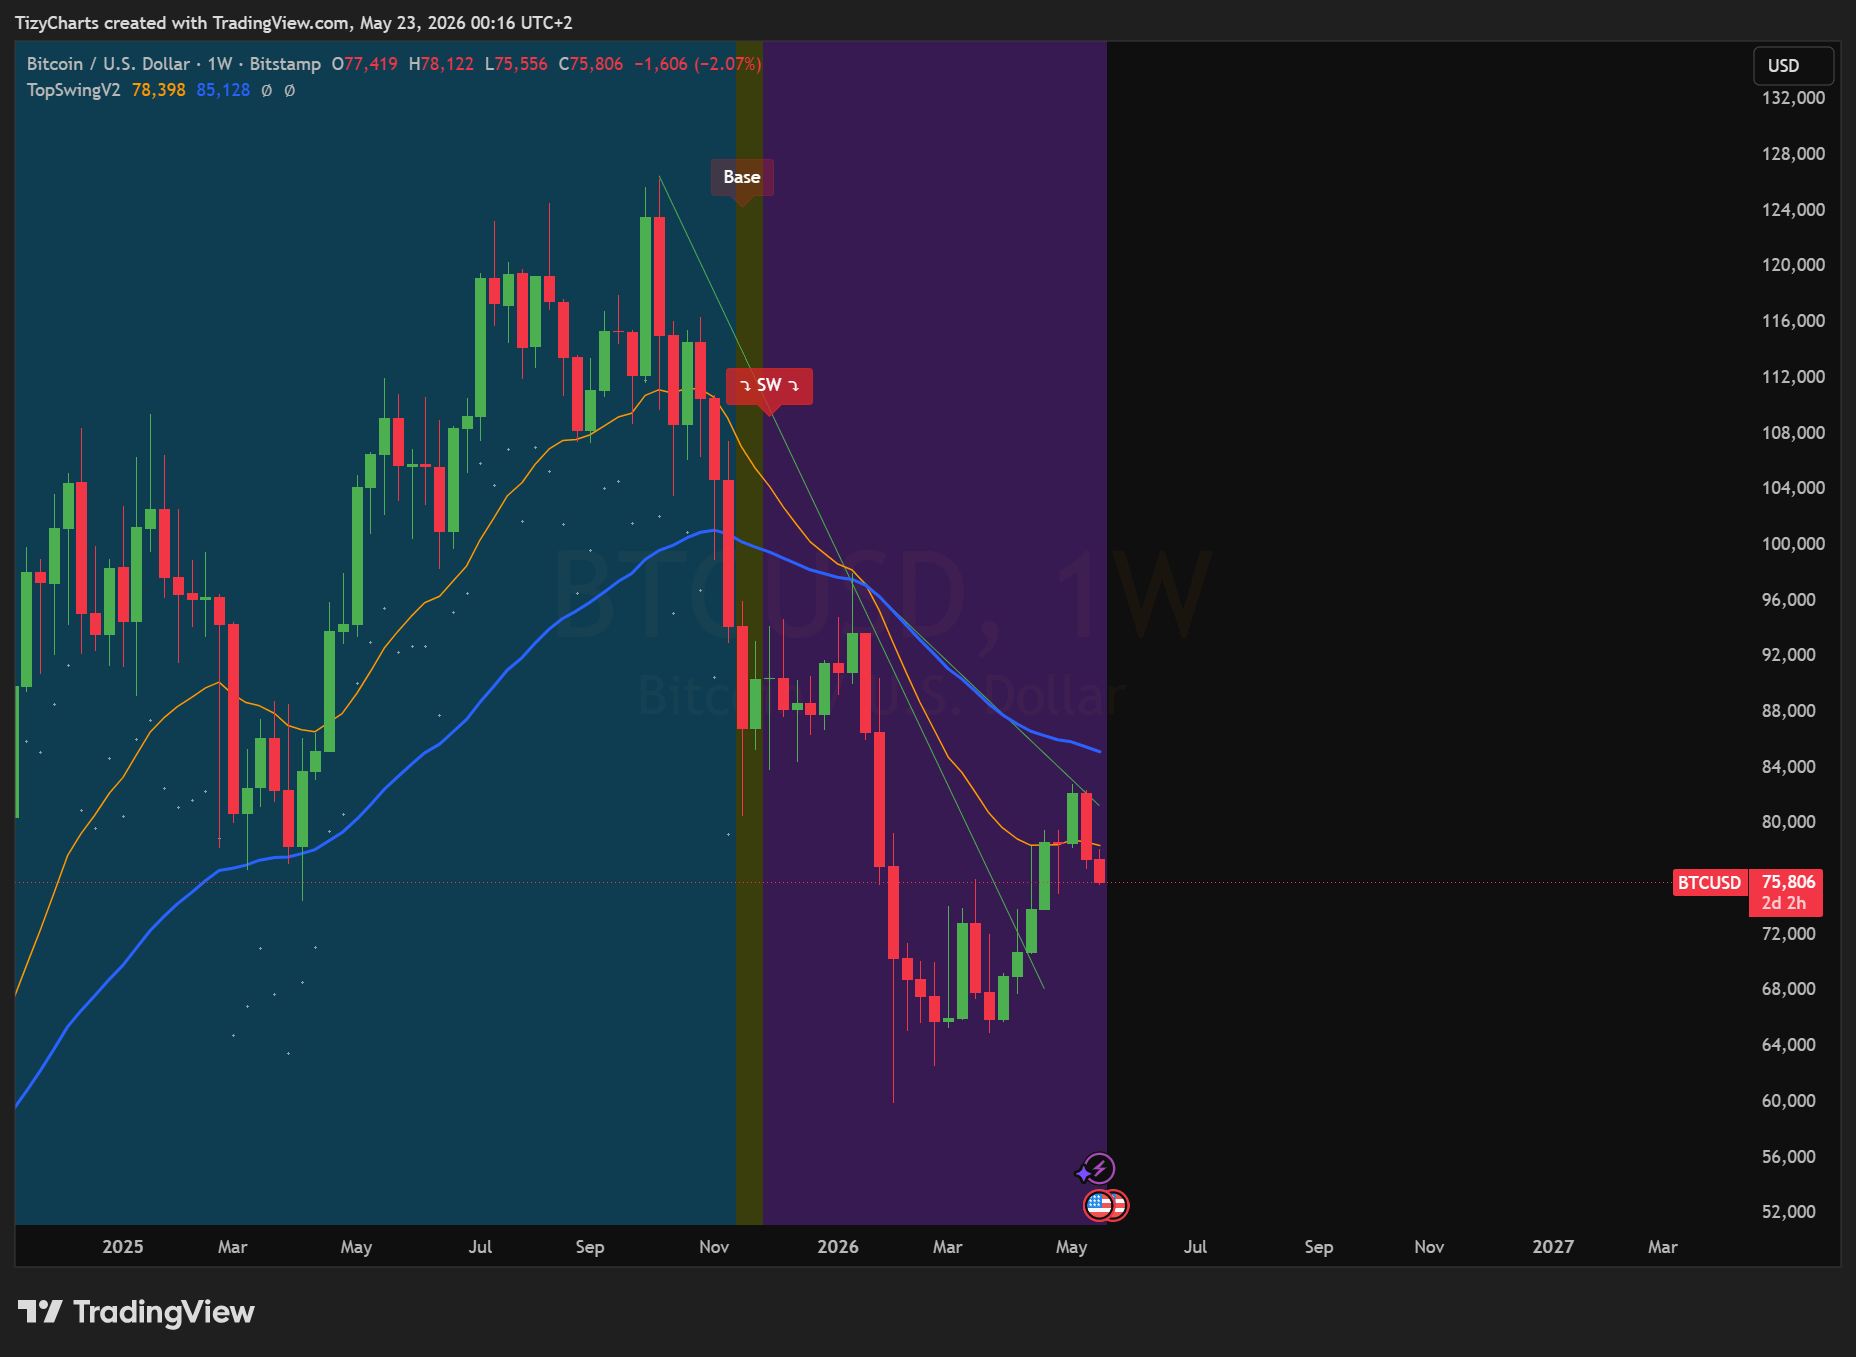
Bitcoin printed another bearish weekly candle with a lower-low weekly bar, although the broader structure continues holding above the EMA 21W, which remains the most important support currently visible on the chart.
The EMA 50W continues acting as the next major structural test, while volatility inside the current sequence continues increasing.
🛢️ USOIL Weekly
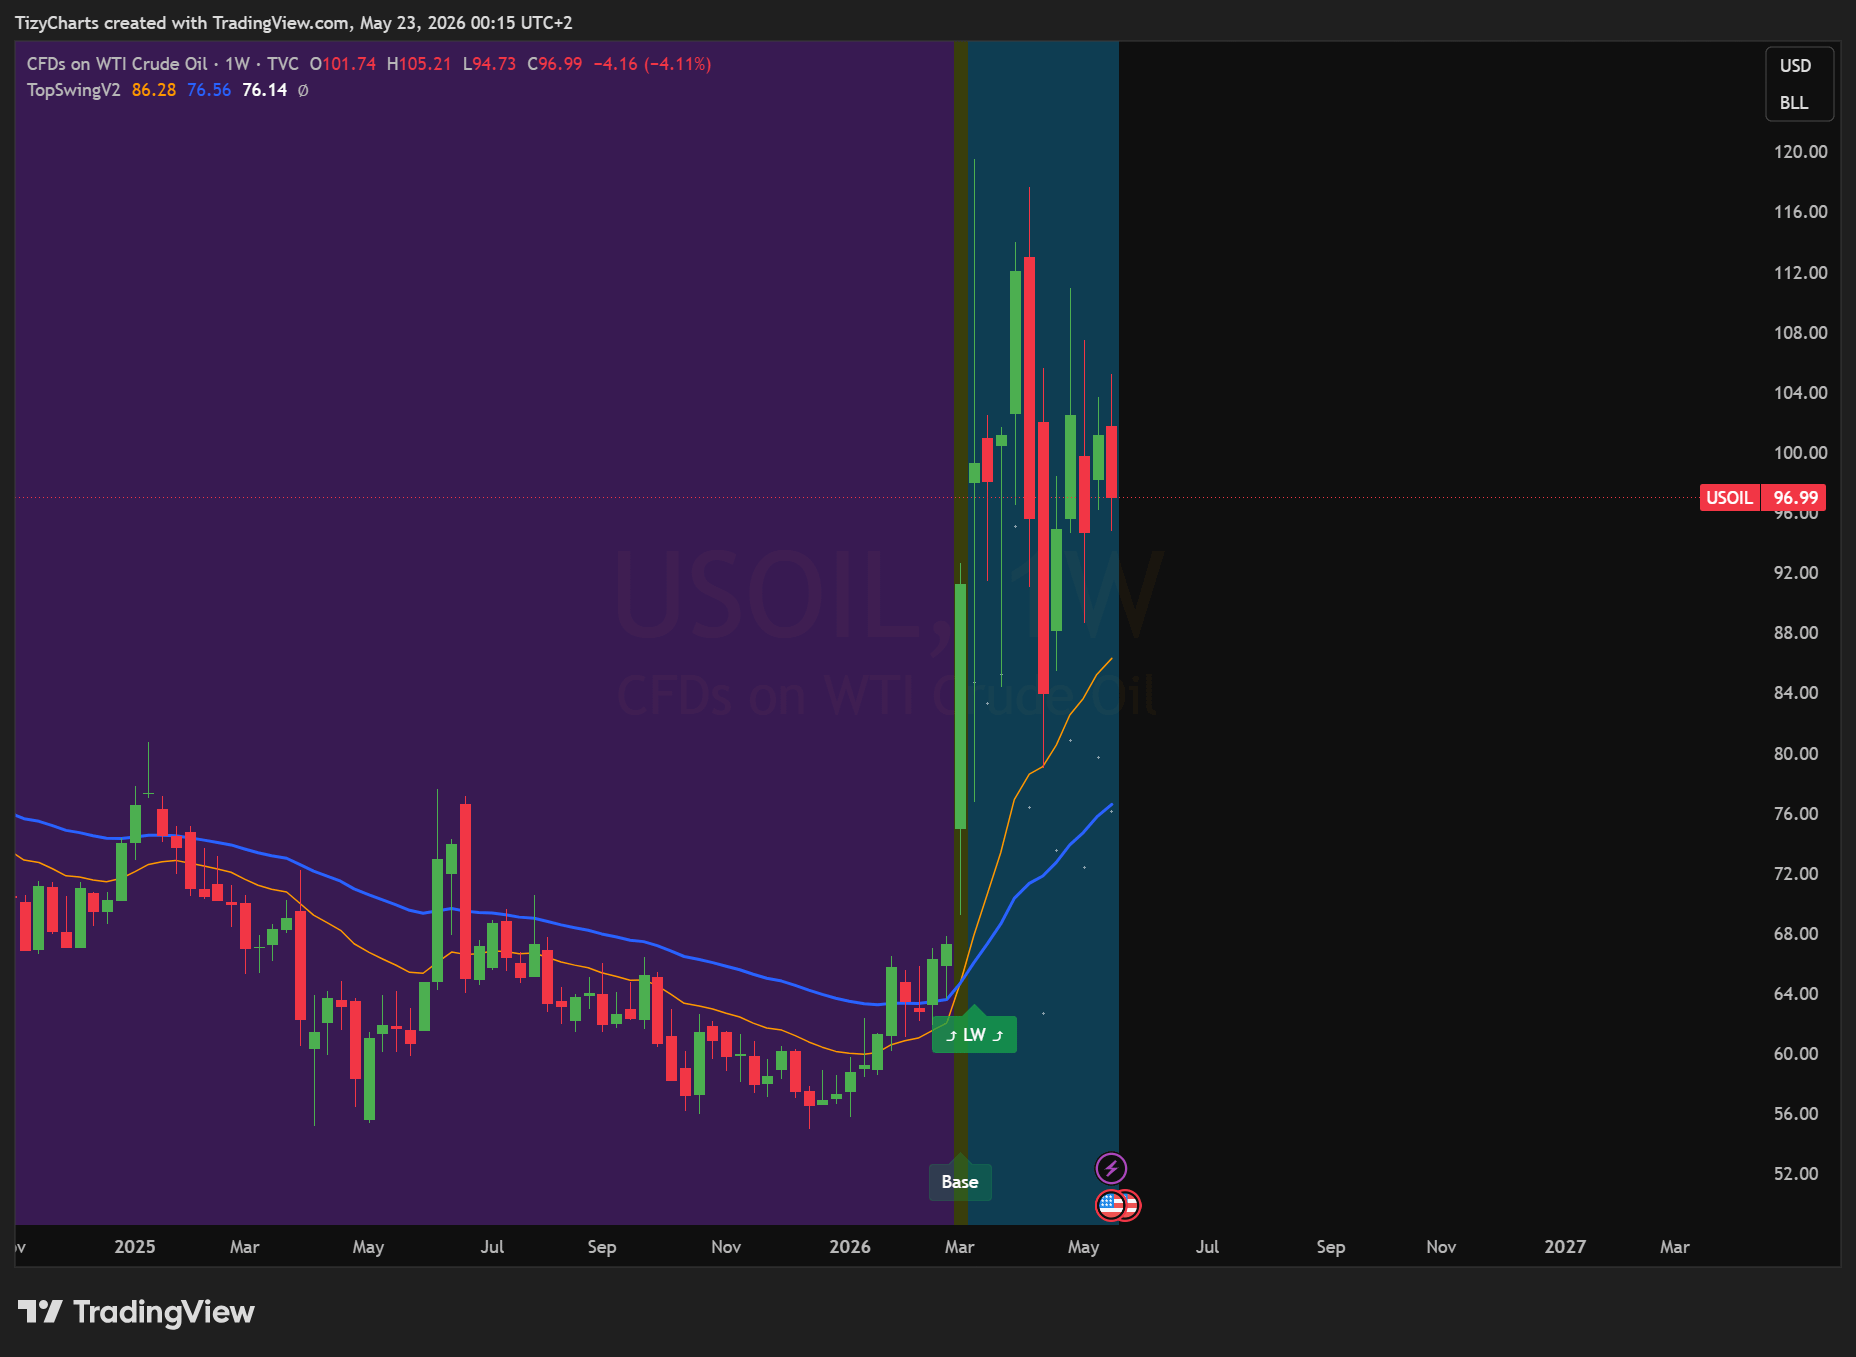
USOIL continues trading inside another consolidation candle while waiting for interaction with the EMA 21W, with the market now spending its tenth consecutive intrabar week inside this broader compression structure.
The longer this range persists, the more meaningful the eventual directional expansion usually becomes.
🥇 GOLD Weekly
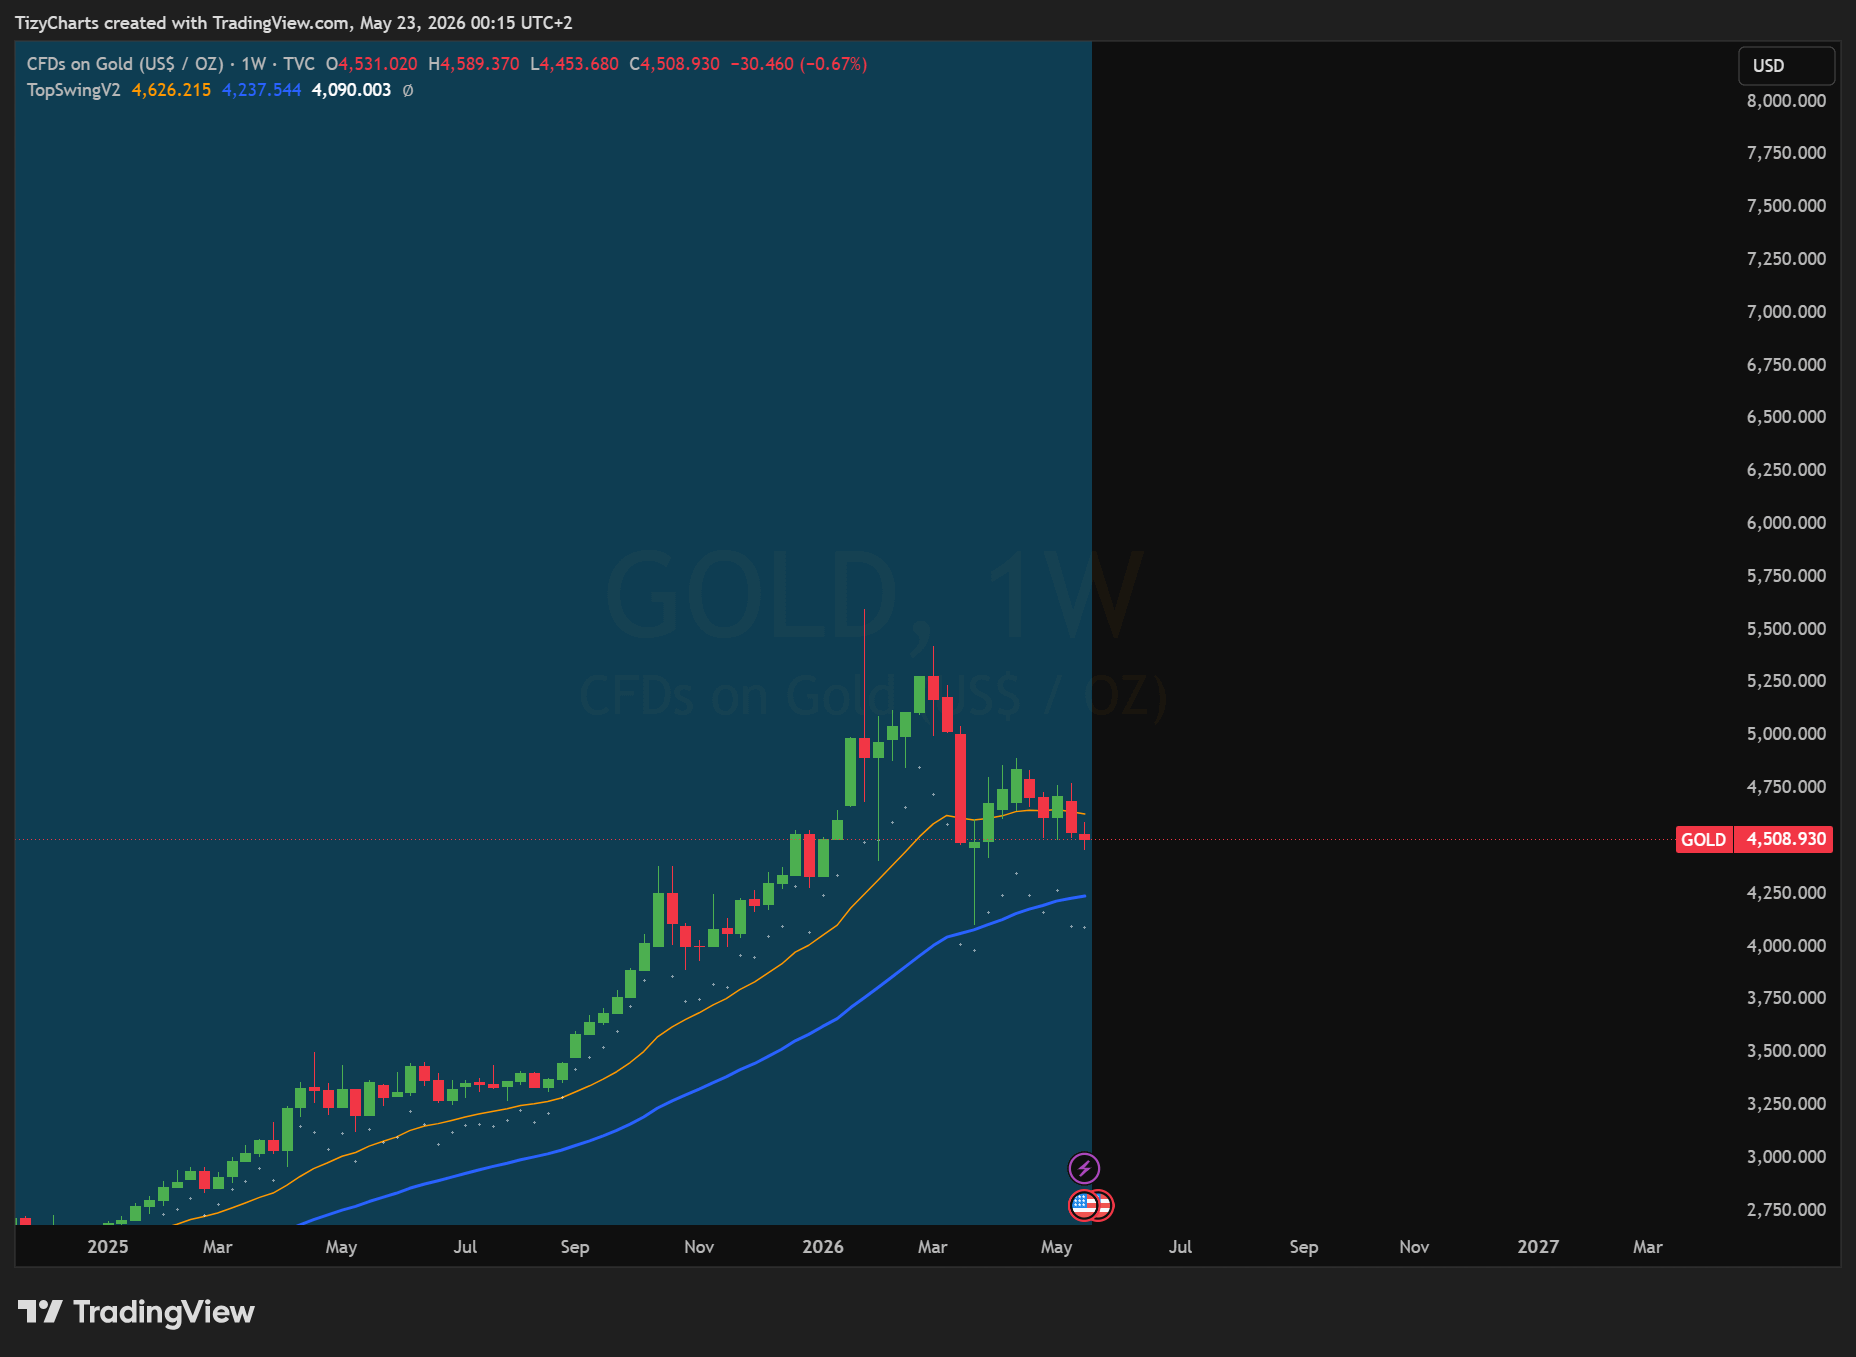
Gold printed another bearish weekly candle with a lower-low weekly bar while definitively losing the EMA 21W as support.
That shift matters structurally because the EMA 21W had previously acted as one of the strongest dynamic support areas during the prior bullish phase.
Momentum continues weakening underneath the surface.
🚀 Join the TizyCharts Community
👉 Free Telegram Channel:
https://t.me/tizycharts
👉 Free & PRO Plans:
https://tizycharts.substack.com/subscribe
🔐 Subscribers follow structured setup tracking, EMA21–EMA50 crossover analysis, multi-timeframe swing structures, and transparent outcome monitoring while setups are still unfolding.
