
Lower Highs Continue, Active Setups +48.26%
Strategy Outcome +406.33% | Structure Still Inside the Range

🔖 MENU
1️⃣ My $ES_F View – Where the Market Is Headed
2️⃣ Swing Strategy Recap
3️⃣ Market Sentiment
⭐ My $ES_F View In Depth (PRO)
1️⃣ My $ES_F View – Where the Market Is Headed
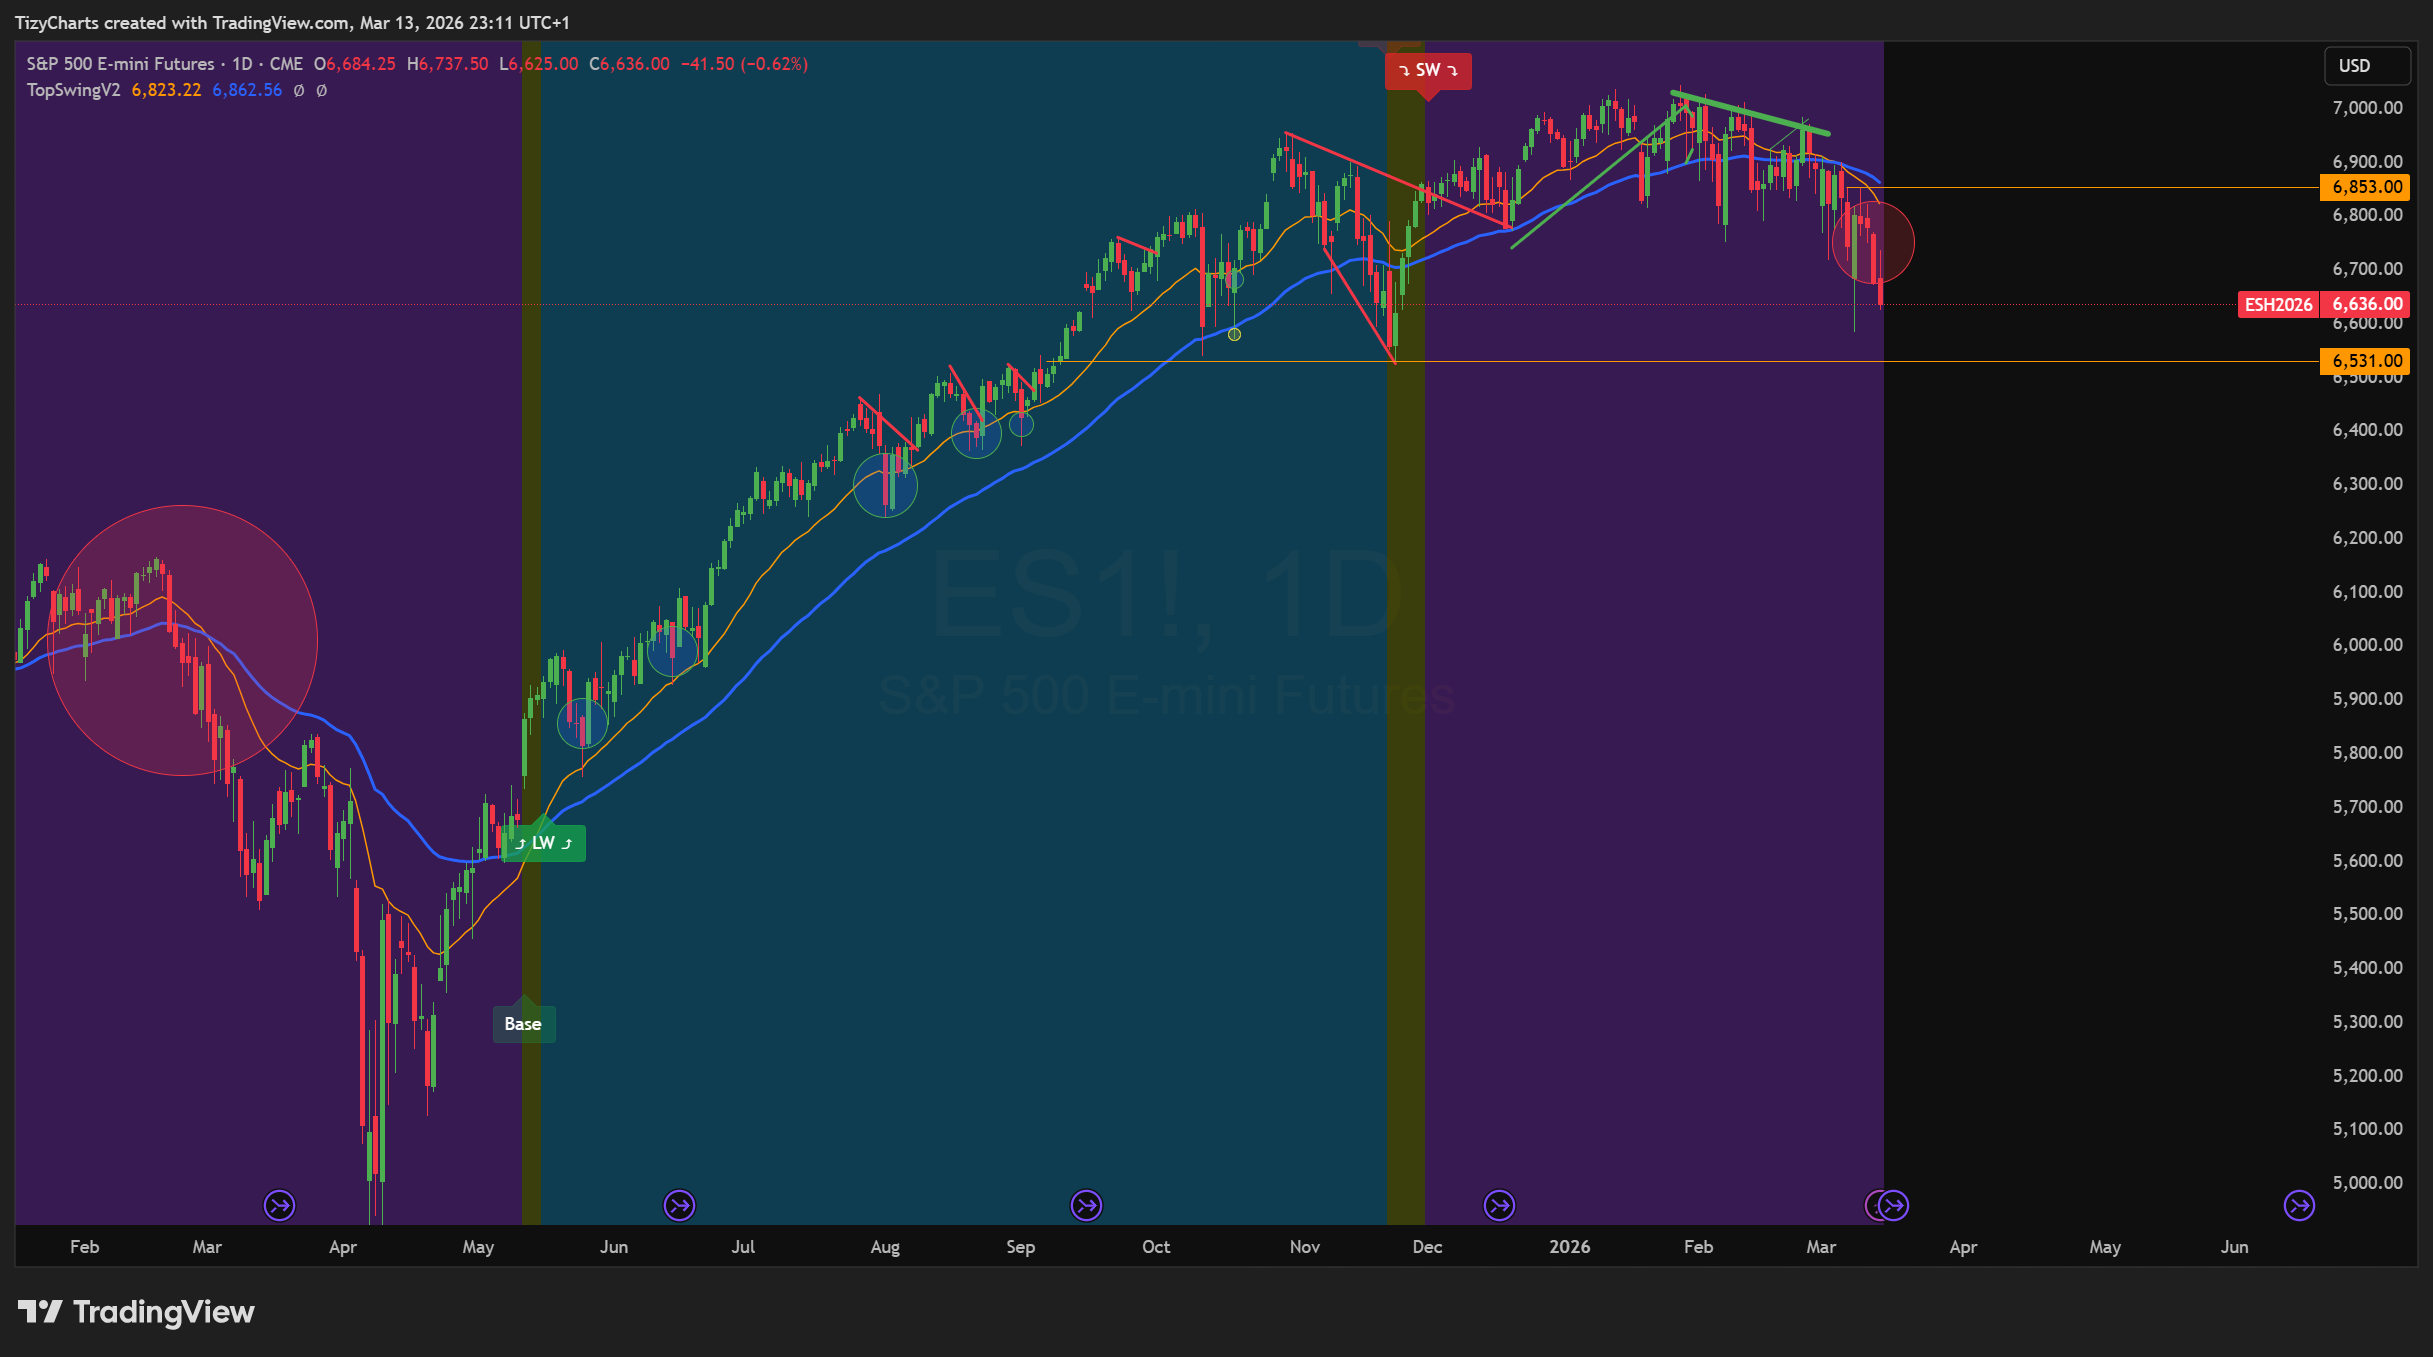
📊 Daily $ES_F — Structure & Behavior Recap
Another bearish daily candle formed with lower highs and lower lows, reinforcing the ongoing pressure within the current phase.
Despite this continuation, price remains inside the range of Monday’s candle, meaning the broader structure has not yet transitioned into a clear expansion.
The next structural support remains near 6500, while 6900 continues to define the main resistance area.
On the Daily timeframe, the market continues moving deeper into a ShortWave Phase. As noted repeatedly, bulls have not yet produced a convincing structural move capable of shifting the broader environment.
For a more detailed short-term perspective, the hourly structure is discussed in the PRO section.
2️⃣ Swing Strategy Recap
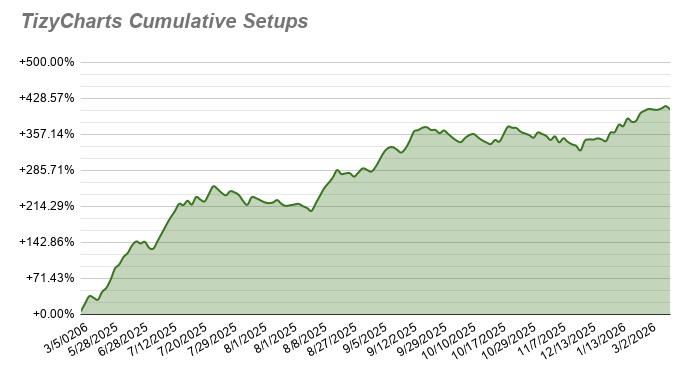
📈 Outcome Chart
📌 Setups Shared
Detailed setup tracking remains available inside the private channels, where movements are followed as a sequence rather than a snapshot.
💼 Strategy Updates
Swing Strategy Updates — March 13, 2026
Several structural updates occurred according to the framework rules.
$BMO was activated at 132.10 and later switched off at 138.00, resulting in a structured outcome of +4.47%.
$AAPL was activated at 272.20 and later switched off at 254.00, resulting in a structured outcome of -6.69%.
These adjustments reflect the ongoing evolution of setups within the current market phase.
Further structural context is available in the PRO section.
💹 Active Setups — Structural Overview
Several setups remain active and structurally in play, even as the broader market continues rotating within its current range.
Active setups currently tracked:
SBUX (#ts165)
OKE (#ts179)
MO (#ts183)
AAL (#ts188)
TSLA (#ts189)
ICE (#ts190)
Cumulative outcome of active setups: +48.26%
Strongest performers currently:
• AAL +17.34%
• SBUX +12.97%
Other positions continue evolving within their structural parameters while the broader phase remains unresolved.
👁🗨 Setups On Watch (No Activation Yet)
LKQ (#ts185)
AFL (#ts187)
These remain under observation while structural confirmation continues to develop.
📈 Outcome Overview
Outcome of Active Setups: +48.26%
Overall Outcome — All-In Risk Management (S.T.): +406.33%
Overall Outcome — Balanced Risk Management (S.T.): +252.49%
📌 Strategy outcome tracking reflects the cumulative evolution of tracked setups over time. It is not CAGR or standardized financial performance.
3️⃣ Market Sentiment
Market sentiment continues to reflect gradual directional pressure combined with structural hesitation.
The sequence of lower highs and lower lows suggests that downside pressure remains active. However, the fact that price continues to stay within the broader range highlights that the market has not yet reached a full resolution.
The alternation between Base, LongWave, and ShortWave phases continues to define the environment more accurately than any single directional move.
From the outside, this may appear like a clear trend once completed. Inside the process, however, the structure is followed step by step while uncertainty is still present.
The phase therefore remains active and still unfolding.
🚀 Join the TizyCharts Community
👉 Free Telegram Channel:
https://t.me/tizycharts
👉 Free & PRO Plans:
https://tizycharts.substack.com/subscribe
🔐 Subscribers follow structured setup tracking, EMA21–EMA50 crossover behavior, multi-timeframe swing setups, and transparent outcome monitoring.
